
Gold’s price is driven primarily by real (inflation-adjusted) interest rates, inflation expectations, and portfolio flows from ETFs and central banks, with the U.S. dollar and geopolitical risk amplifying short-term moves. Understanding these forces gives investors a practical edge in timing allocations and managing risk.
Three signals to watch right now:
- Real yields and inflation expectations: The Chicago Fed’s empirical analysis confirms that a 1 percentage point rise in long-term real rates materially lowers the real gold price. Track the 10-year TIPS yield and breakeven inflation daily.
- ETF flows and COMEX positioning: SPDR Gold Shares (GLD) and other physically-backed ETFs represent roughly one-third of investment demand, per World Gold Council data. Weekly CFTC reports and daily ETF flow data are your early-warning system.
- Central-bank purchases: The World Gold Council (WGC) tracks quarterly official-sector buying, which has become a structural price floor. The LBMA Gold Price PM is the global benchmark settlement reference.
Key Takeaways
Gold’s price is governed primarily by real interest rates and inflation expectations, with ETF flows and central-bank purchases providing the structural demand that amplifies or dampens those macro signals.
| Point | Details |
|---|---|
| Real yields are the core signal | A 1 percentage point rise in long-term real rates materially lowers the real gold price, per Chicago Fed analysis. |
| ETF flows move physical supply | Physically-backed ETFs represent roughly one-third of investment demand; weekly flow data is an early-warning indicator. |
| Central banks set a price floor | Record central-bank purchases in recent quarters remove metal from the market and underpin long-term price support. |
| Supply cannot respond quickly | Annual mine production adds only roughly 2–3% to above-ground stock, making gold prices highly sensitive to demand shifts. |
| Allocation range: 4%–15% | WGC analysis shows this range historically improved risk-adjusted returns; hold in allocated, audited custody for institutional positions. |
Table of Contents
- How do real interest rates and inflation move the gold price?
- How do ETF flows and COMEX futures shape price moves?
- Why does central-bank buying matter for long-term gold prices?
- Why can’t gold supply simply respond to higher prices?
- What do historical episodes teach investors about gold price drivers?
- How can investors access gold, and what does each option cost?
- Where does gold fit in a diversified portfolio?
- What operational standards should institutional investors require?
- How do emerging-market currencies affect gold demand?
- How do ECB and PBOC rate policies influence gold?
- How do behavioral factors and sentiment drive gold prices?
- How does gold market liquidity affect price volatility?
- Galami’s perspective on what institutional investors actually need
- Sources
How do real interest rates and inflation move the gold price?
Real interest rates are the single strongest macro correlator for gold over recent decades. The logic is straightforward: gold pays no coupon or dividend, so when the real return on competing assets like U.S. Treasuries rises, the opportunity cost of holding gold rises with it. Prices tend to fall. When real rates drop into negative territory, gold’s relative appeal surges.
The Chicago Fed’s 1971–2021 regression analysis quantifies this: a 1 percentage point increase in long-term real rates is associated with a material decline in the real gold price. That relationship has strengthened in recent decades as financial markets have grown more integrated and gold ETFs have made the asset easier to trade in and out of.
Inflation expectations matter separately from realized inflation. When investors expect future inflation to accelerate, they bid up gold as a store of value before CPI data confirms the move. The 10-year breakeven inflation rate (the spread between nominal Treasuries and TIPS) is the market’s real-time read on this. Realized CPI and PCE data matter too, but they are lagging signals. The breakeven moves first.
The U.S. dollar adds a second layer. Gold is priced globally in dollars, so a weaker dollar mechanically lifts the price in dollar terms and simultaneously makes gold cheaper for buyers holding euros, yen, or rupees, which expands demand. The DXY or Bloomberg Dollar Index (BBDXY) is the practical tracker here. A sharp dollar rally can cap a gold move even when real yields are falling, which is why watching both simultaneously matters.
Practical indicators to monitor:
- 10-year TIPS yield (real yield proxy)
- 10-year breakeven inflation rate
- DXY or BBDXY for dollar direction
- PCE and CPI releases for realized inflation context
One historical illustration: the early 1980s disinflation under Fed Chair Paul Volcker pushed real rates sharply positive, and gold fell from its 1980 peak for nearly two decades. Then, from 2001 to 2012, real rates trended toward zero and eventually negative, and gold rose from roughly $250 to over $1,900 per ounce. Different dominant driver, completely different outcome.
How do ETF flows and COMEX futures shape price moves?
ETF flows and futures positioning can cause rapid price moves even when the underlying macro signals are unchanged. This is the market plumbing most investors overlook.
Physically-backed ETFs like GLD work through a creation/redemption mechanism: authorized participants create or redeem large baskets of shares against physical gold held in vaults. When retail and institutional investors buy ETF shares, authorized participants acquire physical gold to back them, which directly tightens available market supply. Redemptions do the reverse. State Street’s analysis notes that gold-backed ETFs offer intraday tradability and low tracking error, and have grown to record levels of assets under management since their 2004 launch.
COMEX futures are where price discovery happens in real time. Traders use leverage, which amplifies moves in both directions. The CFTC publishes its Commitments of Traders (COT) report weekly, breaking out speculative (managed money) net long and net short positions. When speculative net longs reach historically elevated levels, the market is crowded and vulnerable to a sharp unwind. When net shorts are extreme, a short-covering rally becomes likely. Neither signal is a precise timer, but both are useful context.
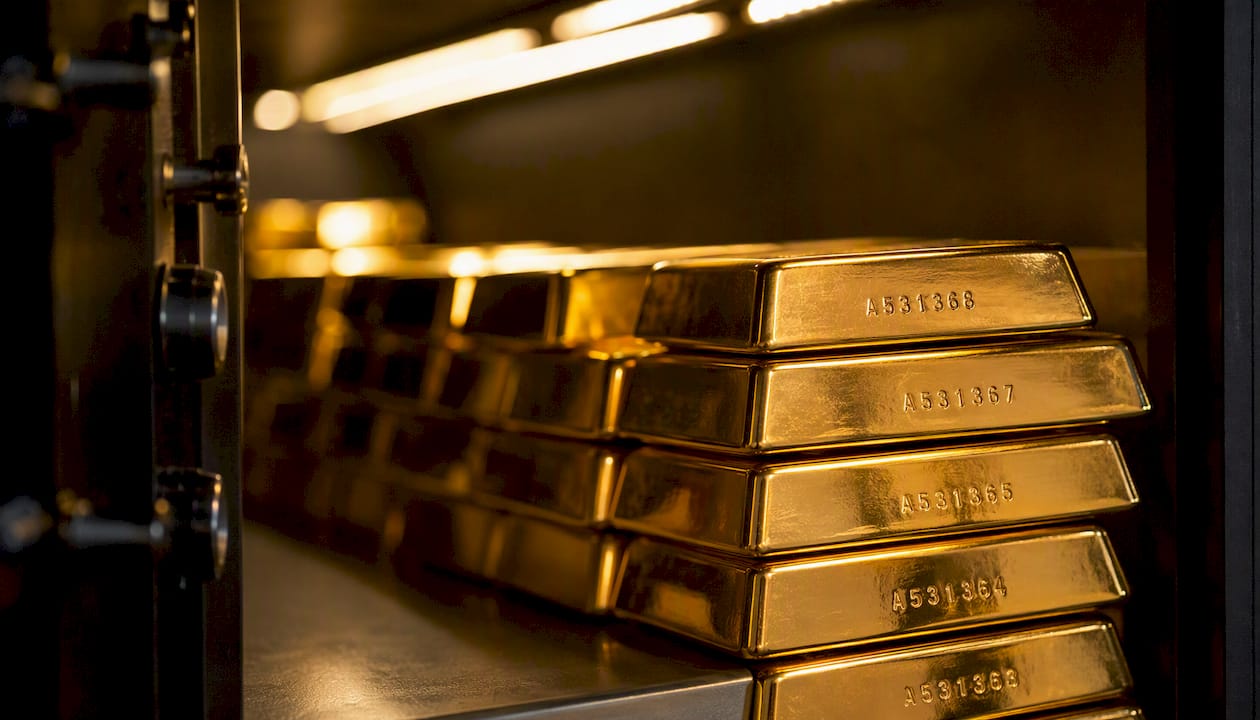
WGC market notes cite COMEX registered inventories and LBMA Gold Price PM as key technical reference points. A drawdown in COMEX registered inventory (gold available for delivery) can tighten physical supply and support prices. Recent reporting from Times of India’s August 2026 market analysis noted notable movements in ETF holdings tonnage and COMEX inventory drawdowns as signals worth tracking for near-term price direction.
Weekly monitoring checklist:
- CFTC COT report (released Fridays, covers Tuesday positions): watch managed-money net longs
- Daily ETF flow reports from GLD and iShares Gold Trust (IAU)
- COMEX registered inventory levels via CME Group data
- LBMA Gold Price PM for the global benchmark settlement
For a deeper look at gold trading strategies that incorporate these flow signals, Galamigold’s tactical framework is worth reviewing.
Why does central-bank buying matter for long-term gold prices?
Central-bank purchases have become a material, persistent source of demand that can underpin gold’s long-term price floor. This is a structural shift from the 1990s and early 2000s, when many Western central banks were net sellers.
The WGC’s quarterly demand reports document this reversal. WGC data shows record central-bank purchases in recent quarters, with emerging-market central banks in China, India, Poland, Turkey, and several Gulf states leading accumulation. The mechanism matters: when a central bank buys gold for reserves, it removes that metal from the market and holds it for years or decades. That reduces the float available to other buyers.
Emerging-market central banks are especially impactful because their purchases are often motivated by reserve diversification away from the U.S. dollar, which means they tend to buy on dips rather than chase rallies. Their behavior is less correlated with short-term price moves than speculative ETF flows, which makes them a stabilizing structural buyer.
What to watch in official-sector reporting:
- WGC quarterly Gold Demand Trends report (published roughly 4–6 weeks after quarter-end)
- IMF International Financial Statistics for monthly reserve changes by country
- Individual central bank balance sheet disclosures (some report monthly, others quarterly)
- Shifts in net buyer/seller status for major reserve holders
India and China also drive large jewelry and bar-and-coin demand, per WGC demand trends research. These culturally driven flows are less price-sensitive than speculative flows and provide a demand baseline that supports prices even during periods of low investor interest.
Why can’t gold supply simply respond to higher prices?
Supply is relatively inelastic in the near term. A demand surge has nowhere to go except price.
The reason is structural. A new gold mine takes 10–20 years from discovery to first production, requiring exploration, feasibility studies, permitting, environmental review, and capital expenditure that often runs into billions of dollars. When gold prices rise, miners do not flip a switch. They begin feasibility work that may produce output a decade later, and many projects never reach production at all due to grade disappointment, regulatory denial, or cost overruns.

Recycling provides some supply elasticity. Higher prices do pull more scrap gold back into the market, from jewelry trade-ins to industrial recovery. But the scale is limited and the response is lagged.
Supply-side signals worth tracking:
- World Gold Council and Metals Focus annual mine production reports
- Major project announcements from large producers (Newmont, Barrick)
- Scrap and recycling volume data in WGC quarterly reports
- Capital expenditure trends across the mining sector as a leading indicator of future output
The supply constraint is one reason gold price trends can be persistent once a demand-driven rally begins. There is no supply response fast enough to cool it.
What do historical episodes teach investors about gold price drivers?
History shows that different driver combinations produce different gold behaviors. Inflation-led rallies look different from safe-haven rallies, and confusing the two leads to poor timing decisions.
1970s stagflation: The dominant driver was inflation expectations, not real rates. As the U.S. abandoned the Bretton Woods gold standard in 1971 and inflation accelerated through the decade, gold rose from $35 per ounce to over $800 by January 1980. The lesson: when inflation expectations become unanchored, gold can move in a sustained, near-parabolic way. The signal was breakeven inflation and CPI momentum, not yield spreads.
2008 financial crisis: Gold initially sold off sharply in the September 2008 liquidity crunch as investors raised cash across all assets. Then it recovered and rallied strongly as the Fed cut rates to zero and launched quantitative easing. The dominant driver shifted from safe-haven demand to real-rate suppression. Investopedia’s analysis of gold price dynamics identifies this episode as a clear illustration of how monetary policy response, not the crisis itself, drives the sustained gold move.
2011 peak: Gold hit a then-record above $1,900 per ounce in September 2011, driven by a combination of negative real rates, European sovereign debt fears, and elevated speculative positioning on COMEX. The subsequent sell-off was triggered by a combination of rising real rates as the Fed began signaling eventual normalization and a sharp unwind of speculative futures longs. The lesson: crowded positioning amplifies both the rally and the reversal.
2020–2026 era: Gold set a nominal record above $5,608.35 per ounce in January 2026, per Investopedia’s price history data. The drivers were layered: COVID-era real rates went deeply negative, ETF inflows surged in 2020, central banks resumed aggressive accumulation, and geopolitical risk from multiple fronts added a persistent premium. In August 2026, FXStreet reported that gold moved on Iran deal hopes and lower U.S. yields simultaneously, illustrating how geopolitical and macro drivers interact in real time.
Key investor lesson from 2020–2026: The combination of negative real rates, record central-bank buying, and ETF inflow created a structural bull market. Geopolitical events added short-term volatility but did not change the underlying trend. Investors who tracked real yields and ETF flows had the clearest signal.
How can investors access gold, and what does each option cost?
Choose the access vehicle that matches your objective. Physical bullion for direct ownership, ETFs for low-friction exposure, futures for tactical leverage, and mining stocks for equity-leveraged exposure each serve a different purpose.
Physical bullion (bars and coins): You own the metal directly. Custody options range from home safes to allocated vault accounts at specialist custodians. The World Gold Council’s investor guide covers the full range of access routes and their cost structures.
Both are physically backed and trade on NYSE Arca with intraday liquidity. Tracking error is minimal. The main caveat: you hold a claim on gold, not gold itself, and in a severe market dislocation, ETF redemption mechanics could theoretically diverge from spot. For most investors, this risk is theoretical rather than practical.
COMEX futures: Highly liquid, with leverage of roughly 15:1 or more at standard margin. Roll costs apply as contracts expire. Futures are best suited to tactical, short-duration positions. Margin calls in volatile markets can force liquidation at the worst time.
Mining stocks: Offer leveraged exposure to gold prices because a miner’s profit margin expands faster than the gold price when costs are fixed. But they carry company-specific risk, operational risk, and equity market correlation that physical gold does not.
Pro Tip: When buying physical gold, compare premiums across multiple dealers and ask specifically about allocated versus pooled storage. Allocated storage means your specific bars are identified and segregated; pooled means you hold a share of a common pool. For institutional-sized positions, allocated and audited is the standard.
For a structured comparison of gold asset types and their portfolio tradeoffs, Galamigold’s resource covers the practical decision points.
Where does gold fit in a diversified portfolio?
A modest strategic allocation of 4%–15% in gold has historically improved risk-adjusted returns for many portfolios, per World Gold Council analysis. The mechanism is correlation: gold tends to be lowly or negatively correlated with equities during equity drawdowns, which is exactly when diversification matters most.
A small allocation is a reasonable starting point for investors who want a hedge without meaningful drag in bull equity markets, while a higher allocation reflects a more defensive posture appropriate when real yields are deeply negative or geopolitical risk is elevated.
Tactical shifts make sense around specific signals. When the 10-year real yield drops below zero, consider moving toward the upper end of your range. When real yields rise sharply and ETF flows turn negative, trimming toward the lower end reduces drawdown risk. Rebalancing triggers should be rules-based: a 2–3 percentage point drift from target is a reasonable threshold to act.
Risk factors to account for:
- Gold pays no income, so opportunity cost is real when rates are high
- Volatility can be sharp in liquidity events (see 2008 initial sell-off)
- Storage, insurance, and ETF expense ratios are a drag on returns
- Tax treatment in the U.S.: physical gold and gold ETFs backed by physical metal are taxed as collectibles at a maximum 28% long-term capital gains rate, higher than the standard 20% rate for equities
Pro Tip: For U.S. investors, holding gold ETFs inside a tax-advantaged account (IRA or 401(k)) eliminates the collectibles tax rate issue. Check with a tax advisor on the specific treatment for your account type.
For a practical framework on managing risk in gold investment strategies, including rebalancing rules and position sizing, Galamigold’s guide covers the mechanics in detail.
What operational standards should institutional investors require?
Institutional trading and custody practices materially affect liquidity and counterparty risk. Professional custody with audited inventories reduces settlement risk in ways that retail-grade storage cannot replicate.
The gold market’s OTC layer, centered on London’s LBMA-member banks, handles the majority of global physical gold trading by volume. COMEX handles futures and options. Institutional buyers operating at scale need to understand both venues and the settlement mechanics of each.
Institutional custody and trading checklist:
- KYC/AML compliance documentation from the trading counterparty
- Segregated (allocated) storage with named bar serial numbers, not pooled
- Independent vault audits at least annually, with published audit reports
- Insurance coverage stated as insured replacement value, not book value
- Chain-of-custody documentation from mine or refinery to vault
- LBMA Good Delivery accreditation for bars (400 troy oz, minimum 99.5% fineness)
- Clear settlement terms: T+2 for spot, with documented delivery procedures
Large institutional trades interact with OTC market depth differently than retail orders. A single large buy or sell can move the LBMA AM/PM fix if it is not properly worked through a liquidity provider. Central-bank purchases, when disclosed, move market expectations even before the physical transaction settles.
Pro Tip: When evaluating a custody or trading partner, request the most recent independent vault audit report, ask for the insured replacement value figure, and confirm whether storage is allocated or pooled. A reputable counterparty provides these without hesitation.
How do emerging-market currencies affect gold demand?
The U.S. dollar is the primary pricing currency for gold, but emerging-market currency dynamics create a secondary demand layer that is often underappreciated. When the Indian rupee or Chinese yuan weakens against the dollar, gold becomes more expensive in local currency terms, which can suppress jewelry and bar-and-coin demand in those markets. When local currencies strengthen, gold becomes relatively cheaper locally and demand tends to pick up.
India and China together account for a substantial share of global physical gold demand, per WGC demand trends data. In India, gold buying is deeply tied to cultural events (wedding season, Diwali) and is price-sensitive at the margin. A sharp rupee depreciation can delay purchases or shift buyers toward lower-karat jewelry. In China, bar-and-coin demand responds to both local currency moves and domestic economic confidence.
For investors outside these markets, the practical implication is that a strong dollar can suppress physical demand from the two largest consumer markets simultaneously, creating a headwind for prices even when Western investment demand is steady. Conversely, a weak dollar environment tends to amplify demand from both directions: Western investors buy more, and emerging-market consumers face lower local-currency prices.
Investors should also watch the Turkish lira and Egyptian pound, where currency crises have historically driven sharp local gold demand spikes as citizens seek a store of value outside the banking system. These episodes add demand that does not show up in Western ETF flow data.
How do ECB and PBOC rate policies influence gold?
The Federal Reserve dominates gold market analysis, but the European Central Bank (ECB) and People’s Bank of China (PBOC) each have meaningful independent effects.
The ECB’s rate decisions affect the euro/dollar exchange rate, which feeds directly into gold’s dollar price. When the ECB cuts rates while the Fed holds, the euro weakens, the dollar strengthens, and gold faces a headwind in dollar terms. The reverse applies when the ECB is tightening while the Fed is easing. European investor demand for gold ETFs and physical bars also responds to ECB policy: negative ECB deposit rates in 2014–2022 made gold attractive to European savers who faced explicit costs for holding cash.
The PBOC operates differently. Its rate decisions affect domestic Chinese credit conditions and the yuan’s value, both of which influence Chinese consumer and institutional gold demand. The PBOC is also a significant gold reserve accumulator, and its reserve management decisions are separate from its monetary policy stance. A PBOC rate cut that stimulates domestic consumption can lift jewelry demand; a PBOC reserve purchase program lifts structural demand regardless of the rate environment.
The practical takeaway: monitor ECB meeting outcomes and the EUR/USD rate as a secondary dollar driver, and watch PBOC reserve disclosures alongside its rate decisions. When all three major central banks are in easing mode simultaneously, the conditions for a sustained gold rally are close to optimal.
How do behavioral factors and sentiment drive gold prices?
Sentiment and herd behavior can move gold prices significantly in the short term, sometimes disconnecting from macro fundamentals for weeks or months. Understanding these dynamics helps investors avoid buying into crowded trades.
The CFTC COT report is the most direct measure of speculative sentiment. When managed-money net longs on COMEX reach historically high levels, the market is crowded. A single negative catalyst (a stronger-than-expected jobs report, a Fed hawkish surprise) can trigger a cascade of stop-loss selling as leveraged longs exit simultaneously. The 2011 peak is a textbook example: speculative positioning was extreme, and the reversal was sharp.
Media coverage and retail search trends (Google Trends for “buy gold”) also serve as contrarian indicators at extremes. Peak retail interest often coincides with peak price, not the start of a rally. Institutional investors who track these sentiment measures use them as a timing overlay rather than a primary signal.
Fear indices like the CBOE Volatility Index (VIX) correlate with gold’s safe-haven premium. When equity volatility spikes, gold often benefits from flight-to-safety flows. But this relationship is not mechanical: in the acute phase of a liquidity crisis (as in September 2008), gold can sell off alongside equities before recovering. The safe-haven bid tends to arrive after the initial panic, not during it.
For investors building a gold investment strategy that accounts for sentiment cycles, the key discipline is separating structural signals (real yields, central-bank flows) from sentiment noise (retail search trends, media headlines).
How does gold market liquidity affect price volatility?
Gold is one of the most liquid commodity markets in the world, but liquidity is not uniform across venues or time zones. Understanding where and when liquidity thins out helps investors manage execution risk.
The LBMA OTC market in London is the deepest pool, handling the majority of global spot and forward trading. The COMEX futures market in New York provides the primary price discovery mechanism during U.S. hours. Between the London close and the New York open, and again during Asian hours, bid-ask spreads widen and large orders can move prices more than they would during peak hours.
In stress scenarios, gold liquidity can deteriorate sharply. During the March 2020 COVID shock, the spread between COMEX futures and London spot prices widened to unusual levels as physical delivery logistics broke down and arbitrageurs could not efficiently move metal between venues. This basis risk is a real operational consideration for institutional traders.
For retail investors in ETFs, liquidity is generally not a concern during normal market hours. But for investors in physical gold or futures, execution timing matters. Placing large orders at the London AM or PM fix, where aggregated demand is matched, typically produces better execution than trading in thin off-hours markets.
The WGC’s market monitoring notes track LBMA price references and COMEX inventory levels as proxies for market depth, providing a useful ongoing read on liquidity conditions.
Galami’s perspective on what institutional investors actually need
Most gold market commentary focuses on price prediction. Institutional investors who have been through multiple cycles know that price prediction is less useful than process. The question is not “where is gold going?” but “what signals tell me when my thesis is changing, and do I have the operational infrastructure to act on it?”
At Galamigold, the clients who manage gold positions most effectively share three habits: they track real yields and ETF flows weekly rather than reacting to headlines, they hold physical gold in allocated, audited custody rather than relying solely on paper exposure, and they treat gold as a portfolio tool with defined allocation rules rather than a speculative trade.
The operational side is where most investors underinvest. Custody documentation, chain-of-custody verification, and independent audit cadence are not exciting topics, but they are what separates a well-constructed physical gold position from one that carries hidden counterparty risk. Galamigold’s physical gold trading platform is built around these standards: institutional-grade execution, transparent pricing, and audited custody. For investors who want to understand the risk framework before engaging, the risk disclosure is the right starting point.
Sources
Staying current on gold market dynamics requires tracking a short list of high-quality, regularly updated sources. Here is what each provides and how often it updates.
- How To Invest In Different Gold Assets | World Gold Council
- Chicago Fed Letter — determinants of the price of gold
- Understanding the Dynamics Behind Gold Prices - Investopedia
- Ways to Invest in Different Gold Assets | State Street
- Gold price prediction today — Times of India (Aug 4, 2026)
For investors exploring portfolio diversification across real assets, including how physical gold compares to other stores of value, additional context on multi-asset allocation is worth reviewing alongside these gold-specific sources.
This article is for general informational purposes only and does not constitute investment, financial, legal, or tax advice. Confirm current regulations, tax treatment, and market conditions with a qualified professional before making investment decisions.
Recommended
- Live gold market prices and insights
- Why gold attracts high-net-worth investors: 18% allocation
- 2026 Gold Trading Trends: Key Insights for Institutions
- What Is Non-Bank Gold Trading? A 2026 Investor Guide
Ready to invest in physical gold trade finance?
Both the Zambia–Dubai and Sierra Leone–Dubai programs are open to qualified investors. Minimum investments from $115,000 USD or €125,000 EUR.
Zambia–Dubai Program Sierra Leone–Dubai Program